blog / tokens and time
Where the tokens actually went
A coding session bills you for four different kinds of token and shows you one number. It spends three different kinds of time and reports one duration. Both of those collapses hide the thing you actually want to know.
Somewhere around the point where I was running six sub-agents in parallel on a single task, I realised I had no idea what any of it cost. Not in a vague way. In a literal way: I could not answer "which agent burned the most", "how much of that was cache", or "was that two hours of work or two hours of me making coffee while it ran".
The transcript was sitting right there on disk the whole time. Claude Code writes every session to ~/.claude/projects/ as JSONL, one line per message, with a usage block on every assistant turn. Everything I wanted was already recorded. Nothing was reading it.
So I wrote session-analyzer: point it at a session, get one self-contained HTML report back.
Problem one: "tokens" is four numbers wearing a trench coat
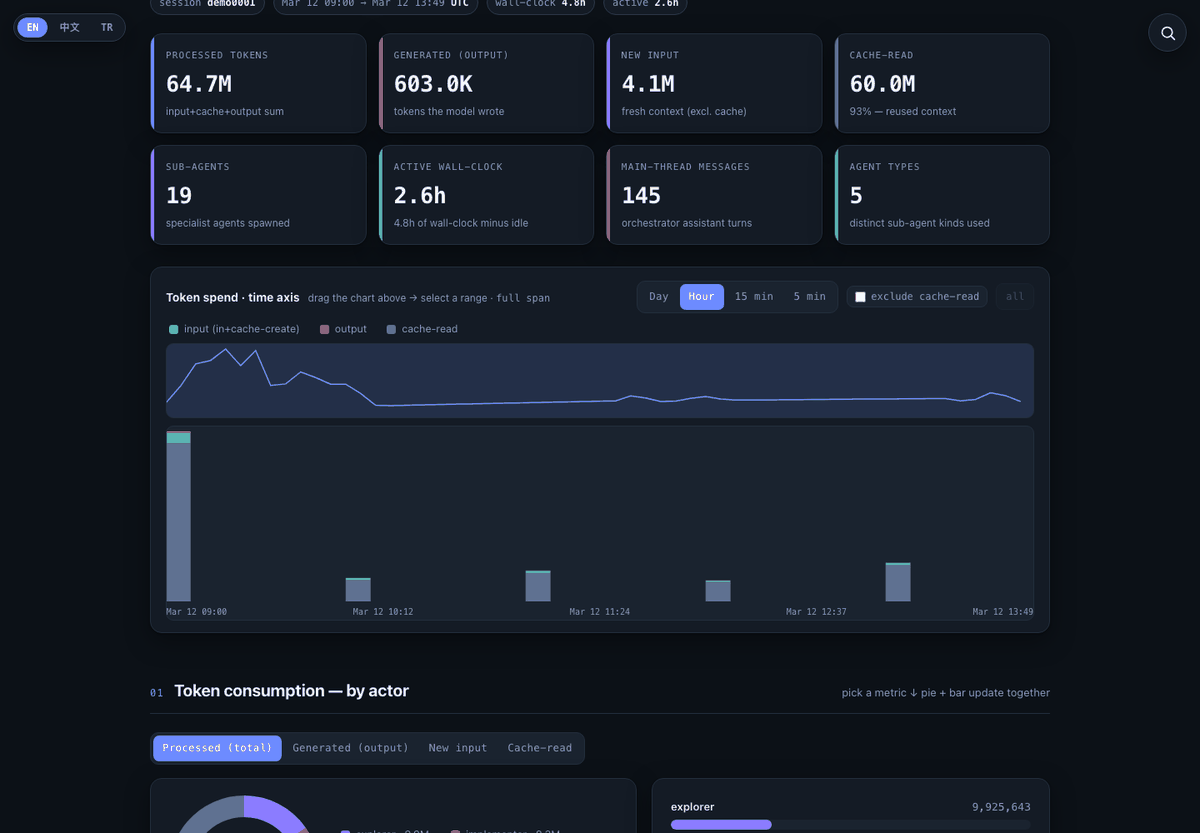
Every assistant message reports four counters, and they are not interchangeable. Summing them into one figure is the default everywhere, and it is the reason cost intuitions are so often wrong.
| processed | input + cache-creation + cache-read + output. The biggest number, and the least useful one on its own. |
|---|---|
| generated | Output only. What the model actually wrote. This is what correlates with wall-clock latency. |
| new input | input + cache-creation. Context you paid full price for, as opposed to context you re-read from cache. |
| cache read | The cheap re-read. Frequently the majority of "processed" in a long session, which is exactly why the headline number misleads. |
Once those are separated, a long session stops looking expensive and starts looking repetitive. A run where 80% of processed tokens are cache reads is not a run that needs a cheaper model, it is a run that is re-reading the same context two hundred times. Different problem, different fix.
Problem two: three kinds of time, one label
This is the one that changed how I plan work. There are three honest answers to "how long did that take", and they are all correct at once.
- Wall-clock. First timestamp to last. What the calendar saw.
- Active wall-clock. The same span with idle gaps removed, where idle means twenty minutes or more with no API call and no running sub-agent. What you were actually waiting on.
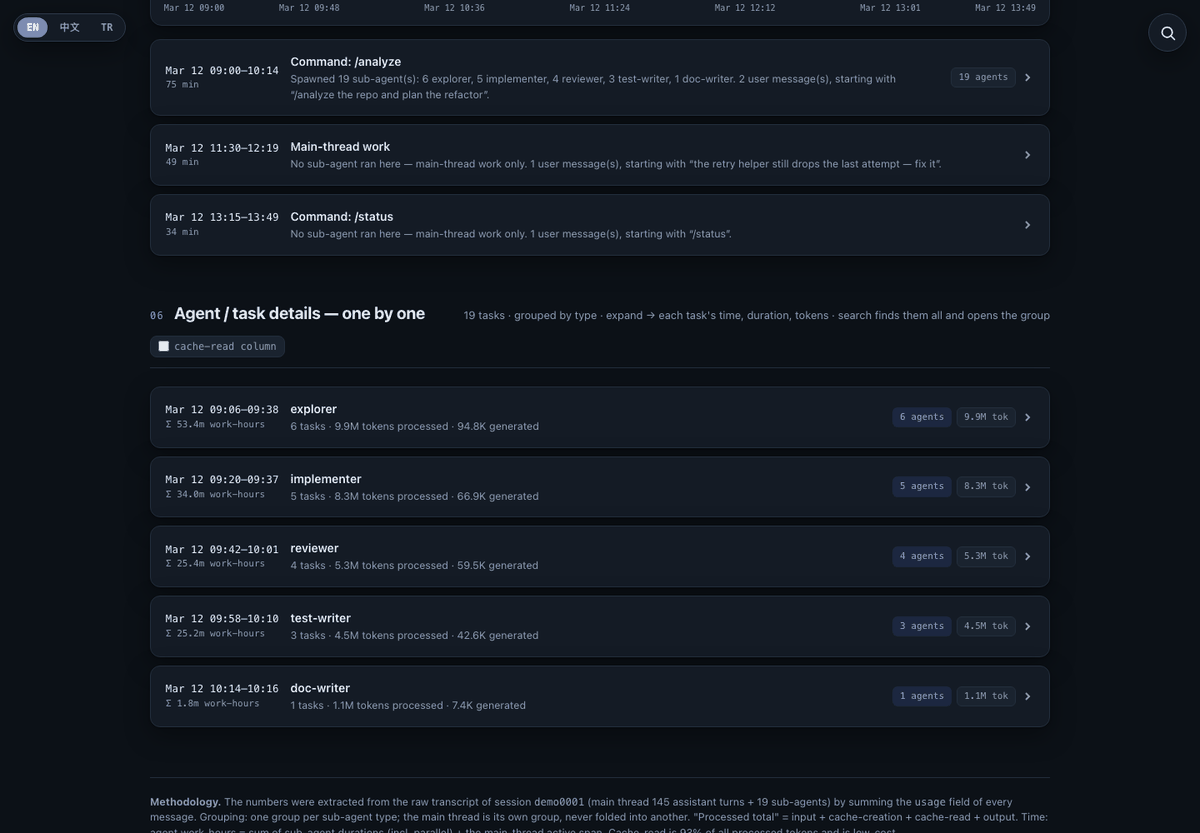
- Agent work-hours. Every sub-agent's duration summed, parallel included, plus the main thread's active span. What the fleet actually did.
Measure three being much larger than measure two is not a bug. Ten agents working an hour in parallel are one hour of calendar time and ten hours of agent work. Reporting either number alone tells a different story, and both stories are true.
The gap between wall-clock and active wall-clock is the number I look at first now. It is the honest measure of how much of a session was me being the bottleneck.
What the timeline gave away
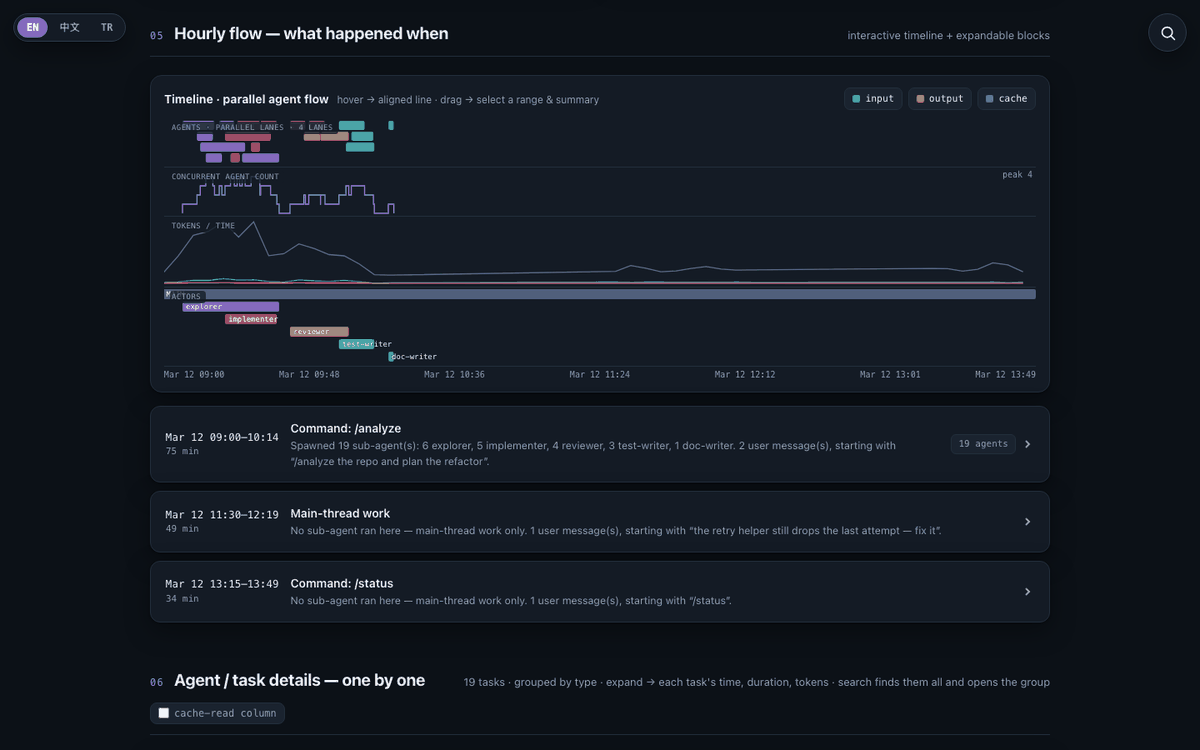
Seeing concurrency drawn rather than described is what made the waste obvious. Three patterns showed up immediately, and I doubt any of them are unique to me:
- Fan-outs that were not fan-outs. Agents launched in what looked like a batch, but the lanes were staggered: each one was waiting for the previous result before it started. The parallelism existed in my head, not in the run.
- One long pole. A five-agent round finishing in the time of its slowest member, with four lanes idle for most of it. Obvious in a picture, invisible in a summary.
- Cache-read spikes with no output. Large processed-token blocks that generated almost nothing. Context churn, not work.
The build constraints, and why they mattered
A report about your session contains your session: task descriptions, typed commands, the first line of every prompt. That single fact set the architecture.
- Nothing is uploaded, anywhere. The CLI is local by definition. The web version is a static page that reads your file with the File API and analyses it in the tab. There is no backend to upload to, so there is no policy to trust.
- One Python file, standard library only.
analyze_and_report.pyis the analyzer and the renderer. No install step, no virtualenv, nothing to break in six months. - The output is one HTML file. Self-contained, no assets to lose, works from a bare
file://URL. You can archive it, mail it to yourself, or diff two of them.
python3 serve_report.py         # session picker at 127.0.0.1:8799
python3 analyze_and_report.py   # or straight to a report, no UI
python3 analyze_and_report.py --list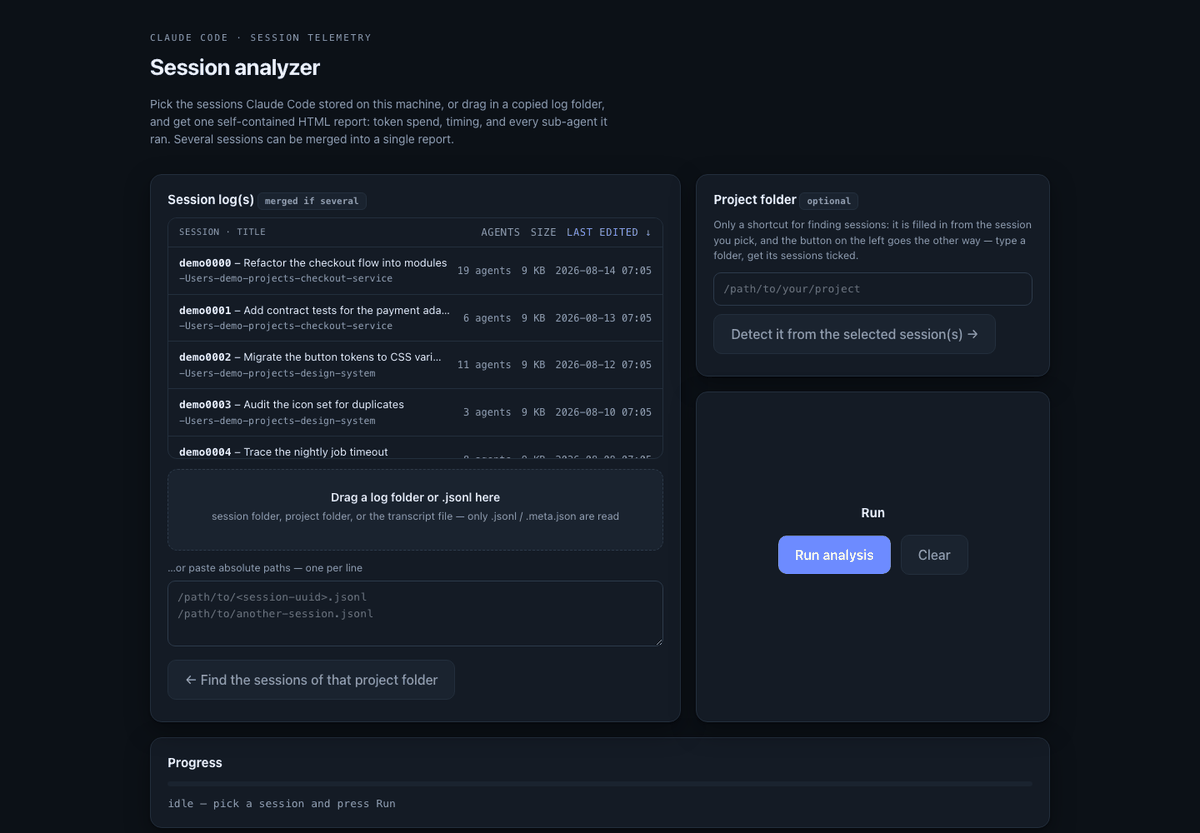
Two implementations, one truth
The aggregation exists twice: once in Python for the CLI, once in JavaScript for the browser build. Two implementations of the same arithmetic is exactly the kind of thing that quietly drifts apart, so there is a conformance test that runs both over the same transcript and fails on any difference, field for field. The renderer has only one source: the Python file, compiled into the web assets by a build step.
That split is the only real complexity in the project, and it earns its place. Without it, either the browser version does not exist or the numbers stop agreeing, and a measurement tool whose numbers disagree with itself is worse than no tool.
What I actually changed after using it
- Stopped chasing "processed tokens" as a cost proxy and started watching new input, which is the number that responds to prompt structure.
- Started batching genuinely independent work instead of assuming a fan-out was parallel because it was written on one line.
- Started quoting wall-clock and agent work-hours together, because quoting either one alone gets an argument.
The interface and every generated report ship in English, Chinese and Turkish, and the language choice is remembered. Adding a fourth is one entry in a translation table.
Drop a session log into the live version and read your own numbers. Nothing leaves the tab.